What You Need to Know about Giving USA 2017
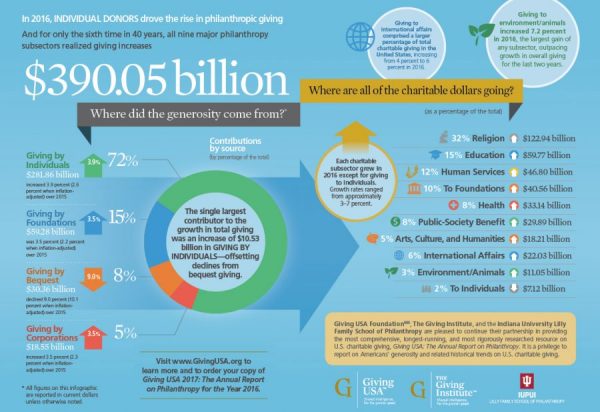
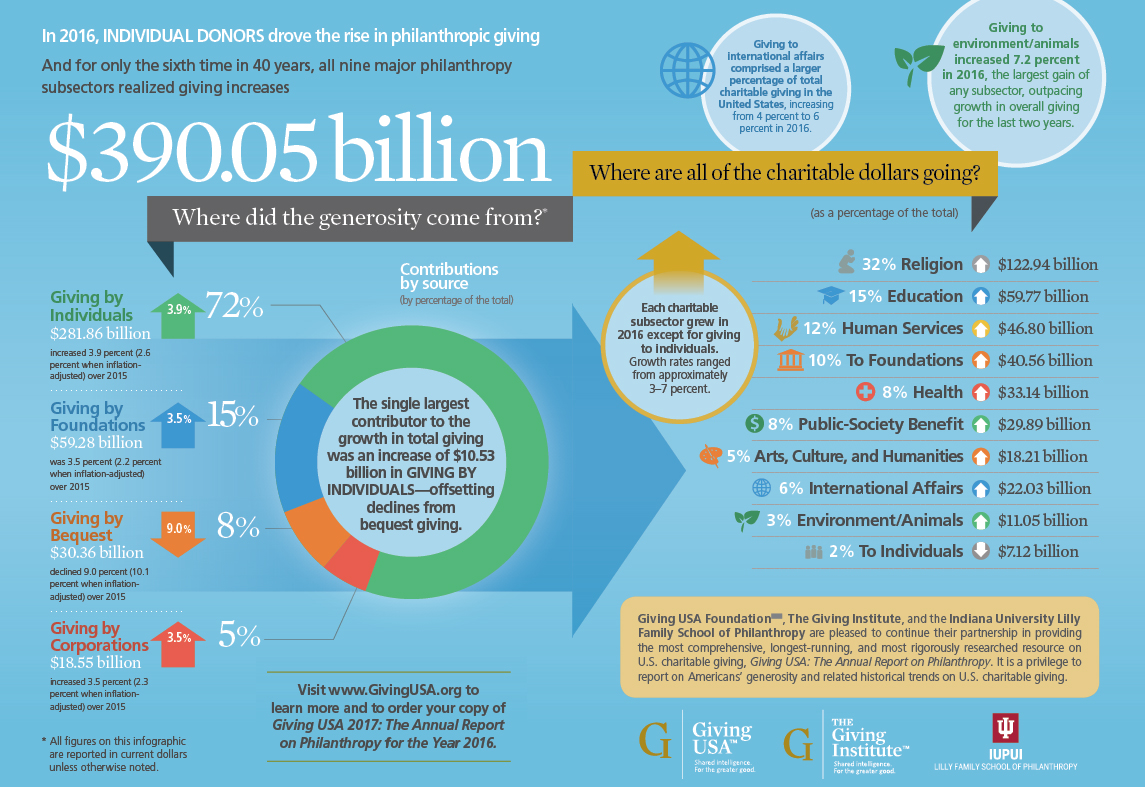
Despite economic and political uncertainly, philanthropic giving still increased in 2016, hitting a record high $390.05 billion. Every year in June, Giving USA releases the “Annual Report on Philanthropy” and provides us with an overall picture of philanthropic giving in the United States. Thanks to Giving USA and the Lilly Family School of Philanthropy, we have the benefit of analyzing the trends over time since they have done this report for 62 years in a row.
Read on for a snapshot view of the results and what they mean for your organization. You can also download a free copy of the report highlights or check out this fun Infographic below in full size .
Individuals and households play a starring role in overall giving, providing 72% of all contributions. Another 15% is given by Foundations, of which half are Family Foundations. Bequests made up 8% of all giving last year, and Corporations stayed steady at 5% of all contributions.
When you look at which types of organizations receive these gifts, the sector is broken down into 9 categories. The biggest ones are Religion (32%), Education (15%), Human Services (12%), and Foundations (10%). The others each bring in between 3 – 8% of all contributions and include environment/animals, international affairs, arts, culture & humanities, public society benefit, and health. All nine of these subsectors experienced increased giving in 2016, and this has only happened six other times in the past 40 years.
But how can this information actually help you with fundraising? Understanding overall giving over time can help you plan for future fundraising efforts at your organization. For example, these trends can help you:
– be more informed when entering into strategic planning
– incorporate international data into your donor communications
– enhance your case for support showing how your organization compares to national trends
– anticipate how developing trends might impact your organization in the future
– educate your stakeholders about charitable giving
For a more detailed analysis of these trends, join me at AFP’s Coffee Chat on August 10, 2017. I’ll be presenting a summary of the Giving USA results and facilitating a discussion with development professionals about how to apply this information to our organizations. It’s free to attend, so add it to your calendar now:
AFP Coffee Chat
Fluid Coffee Bar
August 10, 2017
8 – 10am
I hope to see you there!